Hook Rates Are a Scam: 10,000+ Ads Show Zero Correlation With Winners
Every creative strategist on LinkedIn, every Meta guru on Twitter, every SaaS platform selling creative analytics. They all preach the same thing: hook rate is the most important creative metric. We had it as a custom column in every ad account. Meta just added it to the dashboard. Teams have spent thousands of hours dissecting Hook A versus Hook B.
We ran the analysis on 10,000+ ads across our client portfolio. The correlation between hook rate and an ad being a winner is effectively zero.
Not across all ads, where industry and audience differences would muddy any signal. Within each test batch, with everything else held constant. Same brand, same audience, same campaign. The within-batch correlation between hook rate and winner status is 0.036. That is statistical noise.
How the analysis ran
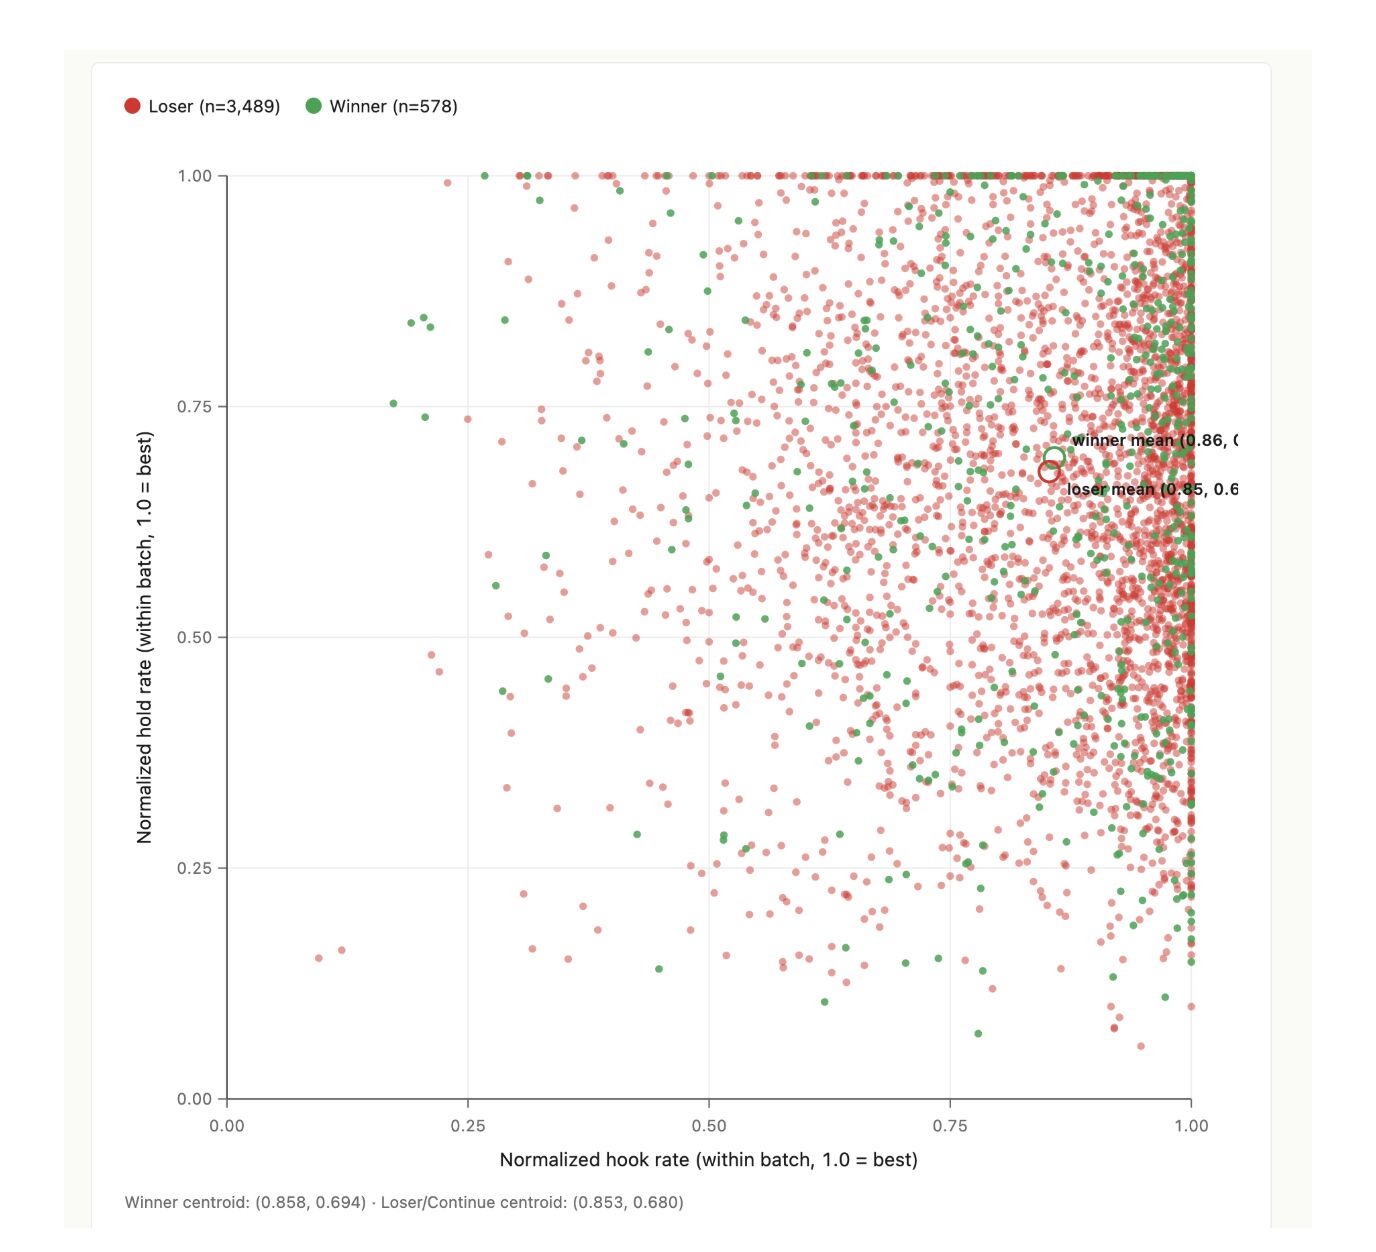
Framework, our statistical testing engine, tags every ad in every test batch by hook rate, hold rate, CTR, and downstream conversion outcome. Winners are declared at 95% confidence interval against control. The dataset is 4,067 ads across 23 client accounts, every ad rank-normalized within its own batch so a winner in a fintech account is comparable to a winner in a mobile gaming account.
The question we were testing: does a high hook rate, relative to other ads in the same batch, actually predict whether that ad goes on to win the test? If the LinkedIn consensus is right, the answer should be a clean monotonic gradient. Top-quartile hook-rate ads win significantly more often than bottom-quartile.
It's not. The data shows something else.
Winner centroid: 0.858 hook rate, 0.694 hold rate. Loser centroid: 0.853 hook rate, 0.680 hold rate. The two groups of ads are statistically indistinguishable on these metrics.
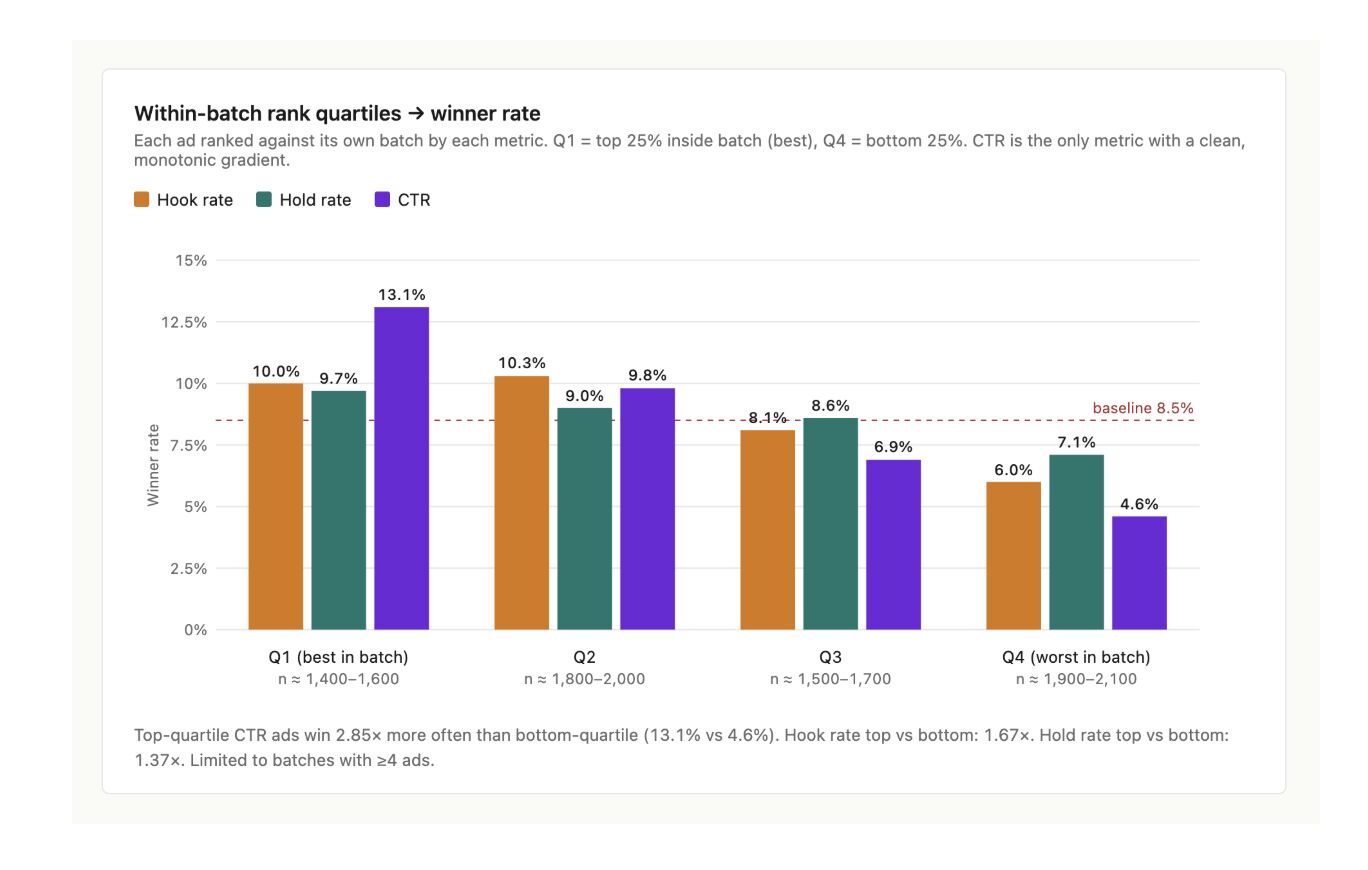
The quartile breakdown
Rank each ad against the other ads in its own batch. Q1 is the top 25% within the batch (the highest hook rates, hold rates, or CTRs among its peers). Q4 is the bottom 25%. Across the dataset, here's how often each quartile produces a winner. The baseline winner rate is 8.5%.
- ›Hook rate Q1 (best): 10.0% winners. Q4 (worst): 6.0%. Top-vs-bottom ratio: 1.67×.
- ›Hold rate Q1: 9.7%. Q4: 7.1%. Top-vs-bottom ratio: 1.37×.
- ›CTR Q1: 13.1%. Q4: 4.6%. Top-vs-bottom ratio: 2.85×.
CTR is the only metric with a clean monotonic gradient. Hook rate does have a directional signal, but the difference between Q1 and Q4 is small enough that filtering on it as a primary metric will throw out roughly as many winners as it surfaces.
Even CTR is a weak predictor
CTR was the only metric to show a meaningful gradient in the quartile breakdown, but the correlation across the full dataset is r ≈ 0.15. That's a small effect. CTR is useful as a screen — bad CTR almost certainly means a bad ad — but it explains roughly 2% of the variance in which ads actually win the conversion test.
All three of these metrics share the same flaw. They measure engagement. A high hook rate means the ad caught attention. A high hold rate means people watched more of it. A high CTR means they clicked. None of those is the thing the campaign is paying for. The thing the campaign is paying for is the downstream conversion event: install, subscribe, purchase, lead.
Why hook rates fail as a predictor
Engagement is table stakes in 2026. Production quality is higher than it has ever been. Hook libraries are public. The fast cuts, the bold opening question, the camera-direct first line, the pattern interrupt. Anyone can shoot a high-hook-rate ad. The variance in hook rates between competently produced ads is small enough that it doesn't predict downstream outcomes.
A high hook rate means you got someone to keep watching for three seconds. That used to be a meaningful filter. It is not anymore. The differentiator has moved downstream, to whether the ad earns the conversion after the hook lands.
What does predict winners? Formats.
The strongest predictor of an ad winning, by a wide margin, isn't a metric. It's a format.
Format here means a specific visual or delivery technique that captures a particular psychological mechanism. Not the broad category — not "UGC" or "podcast clip" or "street interview." Those are containers. Format means the actual structural choice inside the container. The exact framing of the camera. The first ten seconds of dialogue. The visual setup of the offer. The role of the on-screen text.
Our top format in 2026 has worked in 15 of the 23 accounts we've tried it on. That's a 65% hit rate, against a baseline winner rate of ~8.5%. The format is 8× more likely to produce a winner than a random ad in the same testing program.
We're not publishing the format itself in this post. It's the kind of asymmetric information advantage that loses its value the moment everyone runs it. But the point is the unit of analysis. Stop optimizing for hook rate. Start identifying the formats that win, and translate them across accounts.
What this means for testing
Three operational shifts.
1. Stop using hook rate as the primary screening metric. Use it as a sanity check, the way you'd use bounce rate. A 5% hook rate probably means a broken ad. A 90% hook rate doesn't mean a winning ad. The ads that win are spread evenly across the hook-rate distribution.
2. If you're going to use a top-of-funnel metric as a directional signal, use CTR. The gradient is real, even if the explanatory power is modest. Top-quartile CTR ads win 2.85× more often than bottom-quartile, which is enough to make CTR a useful filter when sample sizes are small.
3. The real testing layer is format-level, not creative-level. Build a library of formats that have demonstrably outperformed baseline. Test new creatives within those formats. Test new formats against the existing library. The format becomes the unit of optimization, not the individual ad.
Framework, the statistical testing engine NewForm runs, was built around exactly this idea. Every ad is tagged at the format level. Winners graduate the format. Losers retire it. The dataset compounds across accounts because the format hypothesis is portable in a way that a specific ad never is.
The takeaway
The best ads make people feel something. They make people want the product because the format is designed for the person watching. Whether the ad is designed for 20% of viewers or 40% of viewers turns out to matter much less than the LinkedIn consensus assumes. The ads that win don't have unusually high hook rates. They have unusually well-chosen formats.
Hook rate is a vanity metric in 2026. Spend your testing budget somewhere that compounds.
Methodology + sources
Dataset: 4,067 ads across 23 NewForm client accounts, tested through Framework between Q4 2024 and Q1 2026. All ads run on Meta. Hook rate, hold rate, and CTR rank-normalized within each test batch (1.0 = best in batch). Winners declared at 95% statistical confidence against batch control on downstream conversion outcomes.
Original publication: This analysis was first shared by Hamza Alsamraee, CEO and Co-Founder of NewForm, in two LinkedIn posts in May 2026. Part 1 covered the cross-account analysis. Part 2 covered the within-batch correlation and the format discovery.